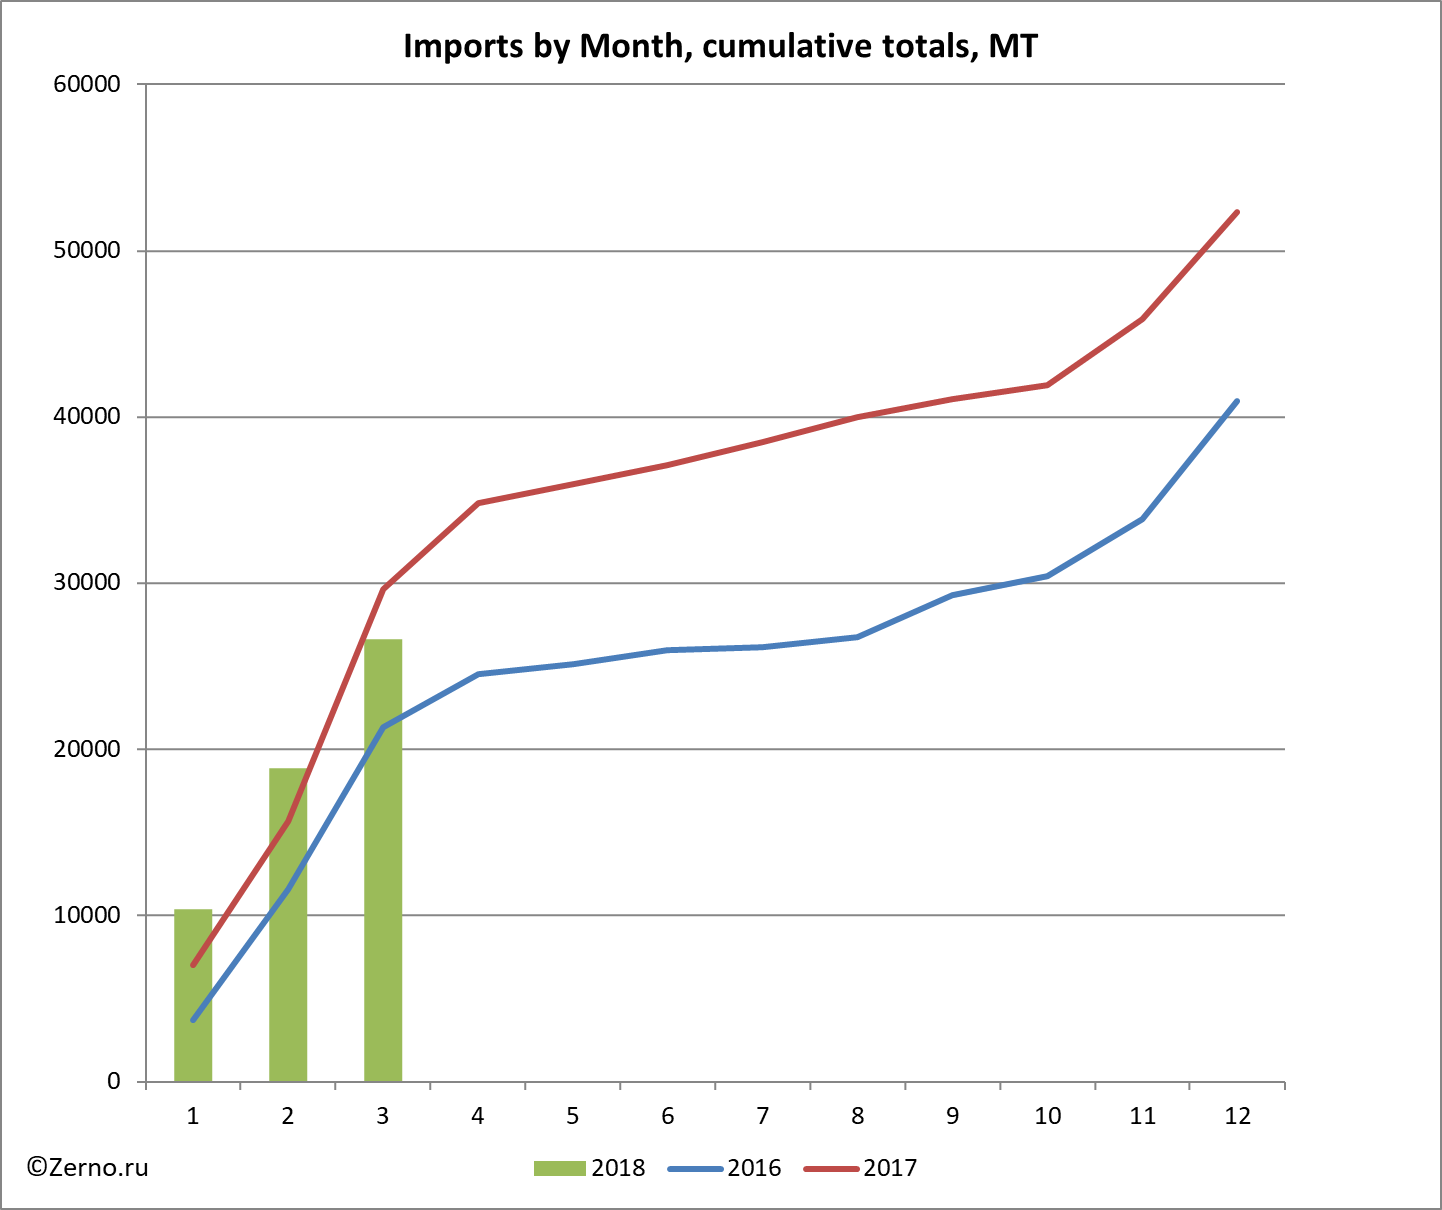
According to the analysis of customs declarations of FCS conducted by Zerno.ru, in March 2018 Russia has imported 7.8 thousand tons of corn. According to the results of 3 months of corn import campaign, Russia has shipped in 26.6 thousand tons (in 2017 - 29.6 thousand MT; in 2016 - 21.4 thousand MT).
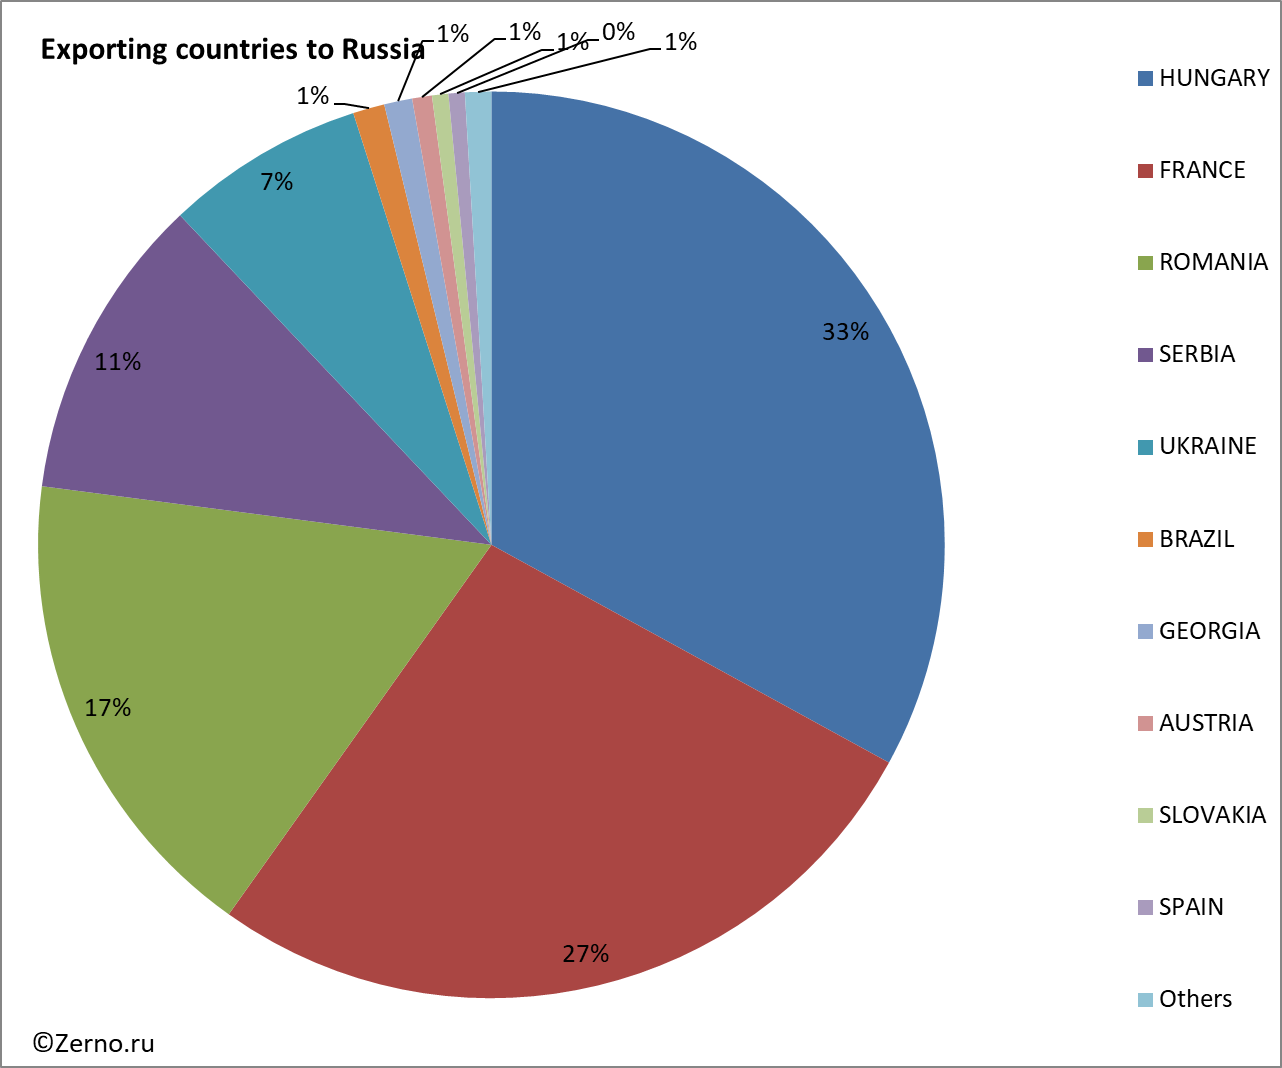
In the period January - March 2018, the main countries exporters of corn to Russia were HUNGARY (32.98%) and FRANCE (26.86%).
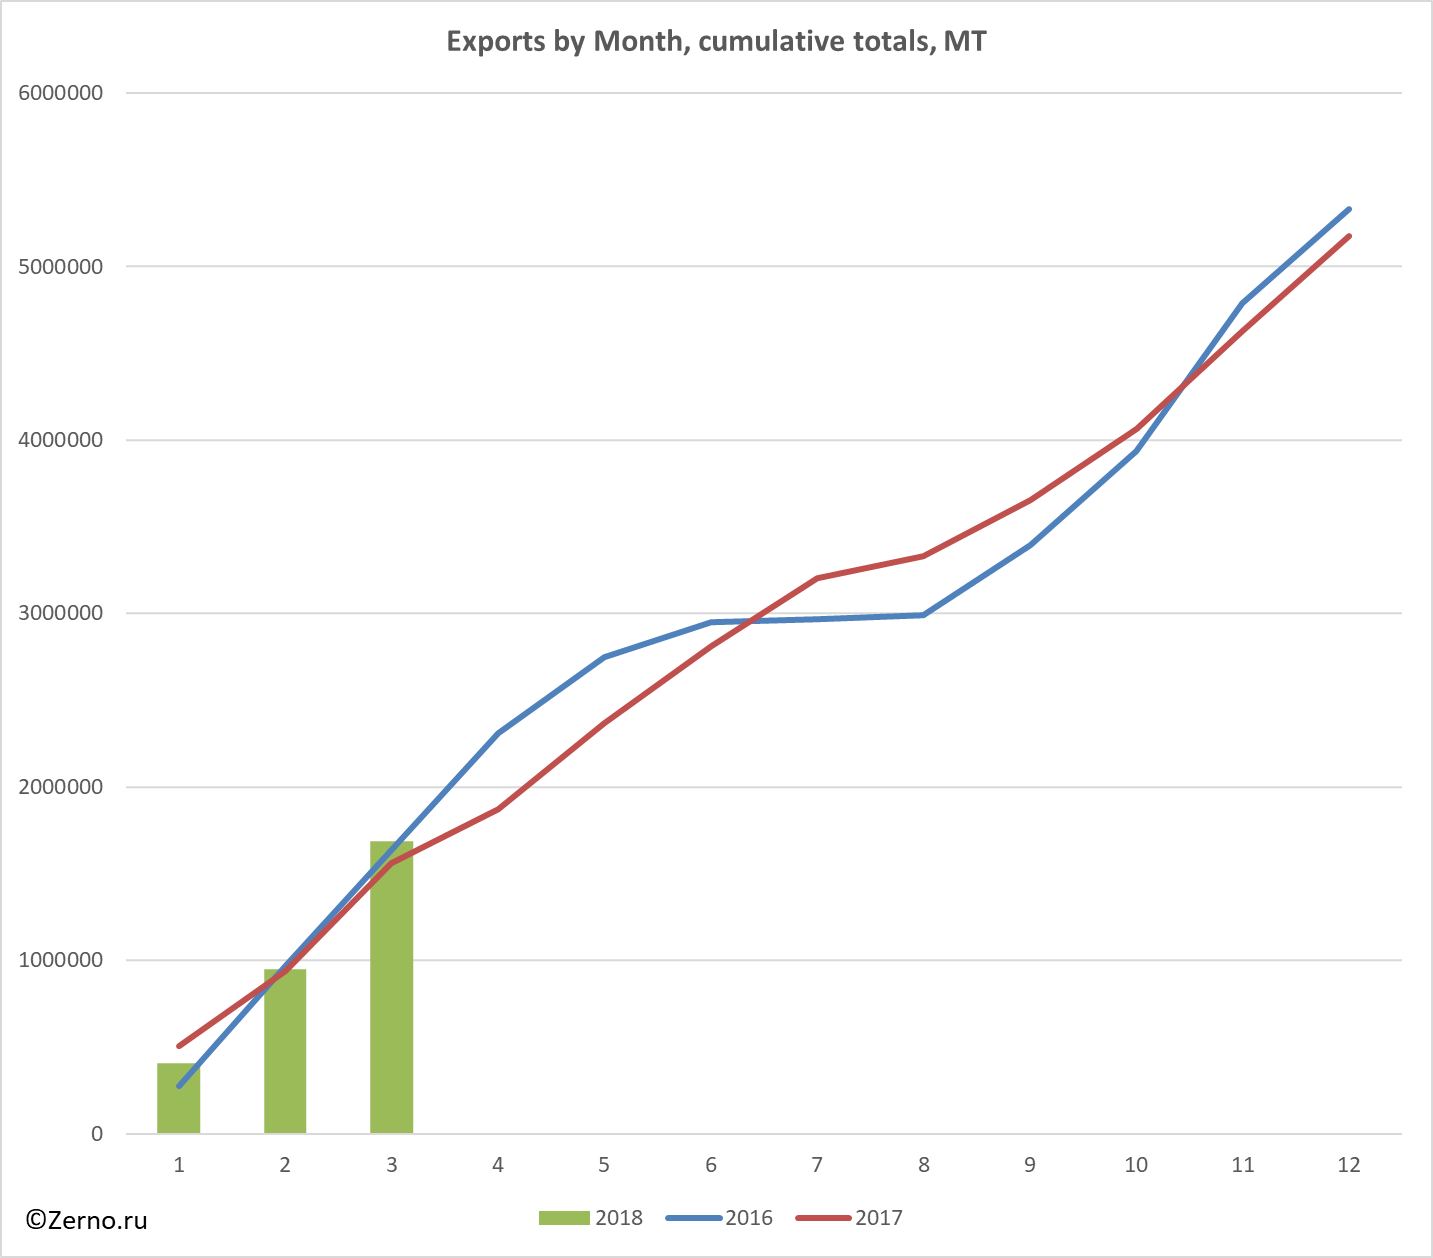
In March 2018 Russia has exported 1686.4 thousand tons of corn. According to the results of 3 months of corn export campaign, Russia has shipped out 1686.4 thousand tons (in 2017 - 1561.1 thousand MT; in 2016 - 1632.7 thousand MT).
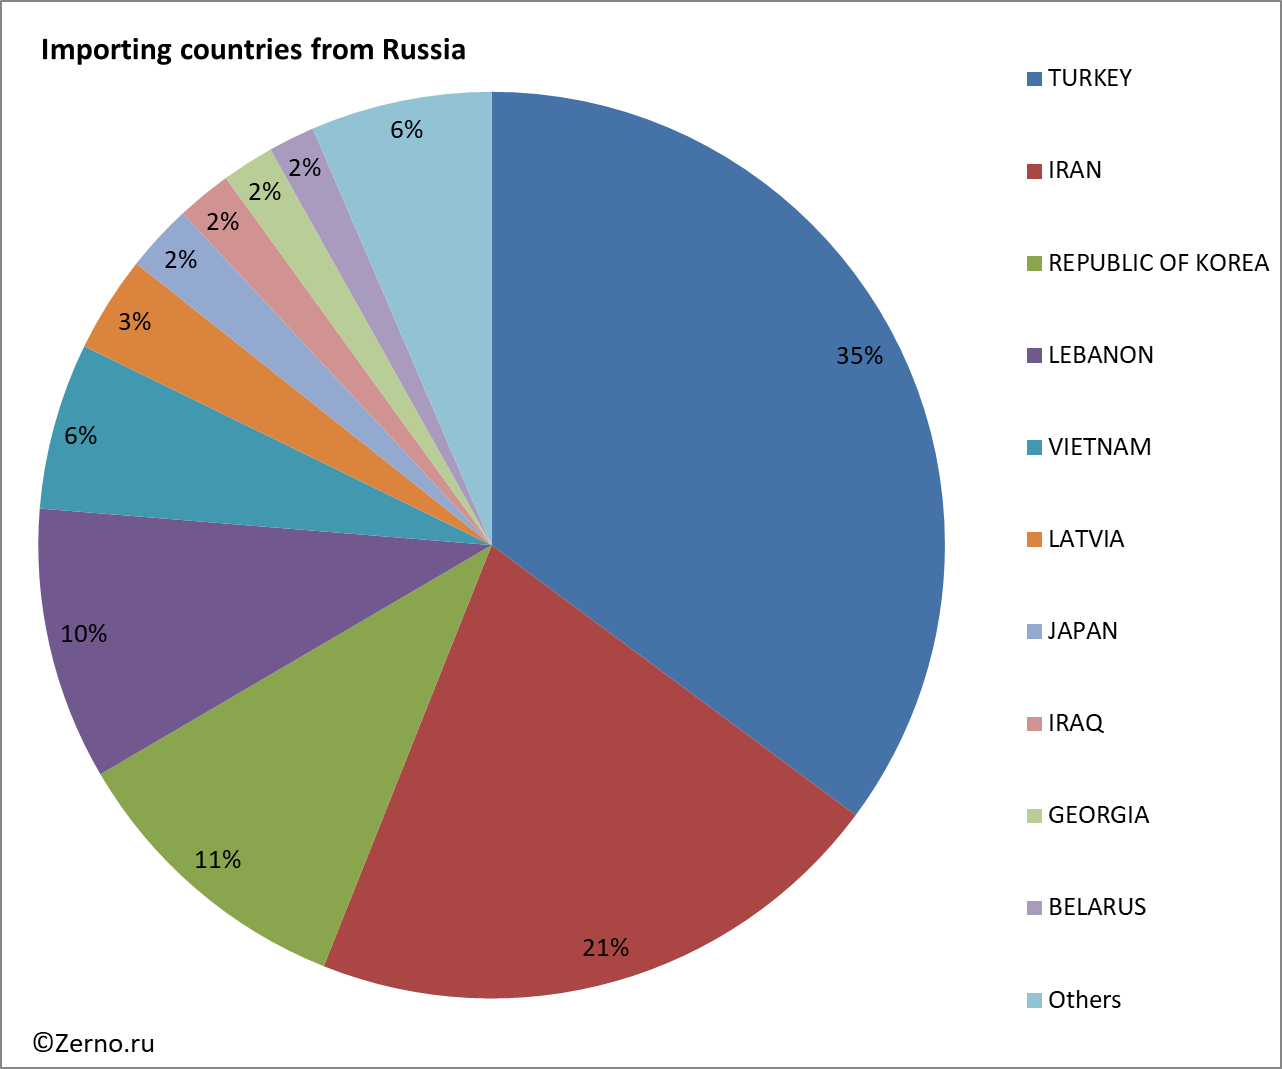
In the period January - March 2018, the main countries importers of corn from Russia were TURKEY (35.16%) and IRAN (20.88%)..
Tables:
- Countries – exporters of corn to Russia in January - March 2018, MT
- Countries – importers of corn from Russia in January - March 2018, MT
- Exports of corn to Russia by month, cumulative total, MT
- Imports of corn from Russia by month, cumulative total, MT
Countries – exporters of corn to Russia in January - March 2018, MT
| Exporting country to Russia, MT / year, month | 2016 | 2017 | 2018 | 2018 Total |
||
| 1 | 2 | 3 | ||||
| HUNGARY | 11894 | 15068 | 5086 | 2534 | 1153 | 8773 |
| FRANCE | 11333 | 12575 | 2966 | 2407 | 1773 | 7146 |
| ROMANIA | 10381 | 8051 | 1932 | 1679 | 973 | 4583 |
| SERBIA | 2506 | 4339 | 276 | 341 | 2278 | 2896 |
| UKRAINE | 6906 | 1117 | 777 | 1894 | ||
| BRAZIL | 1352 | 375 | 150 | 150 | 300 | |
| GEORGIA | 40 | 222 | 266 | 266 | ||
| AUSTRIA | 474 | 793 | 77 | 17 | 93 | 187 |
| SLOVAKIA | 188 | 561 | 116 | 39 | 155 | |
| SPAIN | 69 | 972 | 39 | 47 | 68 | 154 |
| TURKEY | 81 | 138 | 18 | 19 | 68 | 106 |
| NEW ZEALAND | 89 | 175 | 65 | 65 | ||
| GERMANY | 204 | 191 | 11 | 33 | 44 | |
| MOLDOVA | 484 | 266 | 18 | 18 | ||
| POLAND | 103 | 136 | 16 | 16 | ||
| CROATIA | 171 | 22 | ||||
| BELARUS | 19 | 25 | ||||
| CHINA | 110 | 95 | ||||
| CANADA | 58 | |||||
| USA | 369 | |||||
| CHILE | 36 | 34 | ||||
| South Africa | 455 | 400 | ||||
| ARGENTINA | 534 | 972 | ||||
| Total | 40951 | 52318 | 10412 | 8439 | 7752 | 26603 |
 |
Countries – importers of corn from Russia in January - March 2018, MT
| Exports from Russia (breakdown by importing countries), MT | 2016 | 2017 | 2018 | 2018 Total |
||
| 1 | 2 | 3 | ||||
| TURKEY | 838002 | 1320766 | 89404 | 267946 | 235521 | 592872 |
| IRAN | 704386 | 786222 | 116305 | 99241 | 136576 | 352122 |
| REPUBLIC OF KOREA | 936357 | 1010069 | 60671 | 55000 | 61941 | 177611 |
| LEBANON | 409028 | 297258 | 85305 | 5300 | 73295 | 163901 |
| VIETNAM | 64500 | 742516 | 100196 | 100196 | ||
| LATVIA | 72610 | 82285 | 14542 | 24574 | 18890 | 58007 |
| JAPAN | 240339 | 66820 | 10195 | 15457 | 14866 | 40517 |
| IRAQ | 26300 | 33000 | 33000 | |||
| GEORGIA | 85628 | 107123 | 9344 | 10526 | 11510 | 31380 |
| BELARUS | 4944 | 29013 | 3797 | 8991 | 15161 | 27949 |
| SYRIA | 133874 | 61254 | 5750 | 15662 | 21412 | |
| AZERBAIJAN | 79412 | 93833 | 3805 | 2870 | 4332 | 11007 |
| ROMANIA | 52415 | 3114 | 3667 | 3885 | 3070 | 10622 |
| LIBYA | 11913 | 44100 | 10389 | 10389 | ||
| ARMENIA | 626 | 4078 | 213 | 3514 | 5832 | 9559 |
| CHINA | 69260 | 1944 | 570 | 3630 | 3984 | 8184 |
| CYPRUS | 60541 | 27296 | 5500 | 5500 | ||
| NETHERLANDS | 568578 | 66105 | 5251 | 5251 | ||
| SWEDEN | 10008 | 3846 | 2016 | 2104 | 4119 | |
| DENMARK | 76601 | 69435 | 3305 | 3305 | ||
| ALBANIA | 6112 | 3299 | 3299 | |||
| GERMANY | 89149 | 37646 | 1509 | 1538 | 3047 | |
| GREECE | 167022 | 114267 | 3010 | 3010 | ||
| MONGOLIA | 5555 | 3193 | 1966 | 1013 | 2979 | |
| IRELAND | 2666 | 2666 | ||||
| LITHUANIA | 14803 | 17015 | 712 | 1102 | 1814 | |
| UZBEKISTAN | 550 | 995 | 1050 | 420 | 1470 | |
| ESTONIA | 42 | 220 | 44 | 22 | 298 | 364 |
| TURKMENISTAN | 14 | 203 | 203 | |||
| CANADA | 252 | 1784 | 200 | 200 | ||
| KAZAKHSTAN | 9482 | 3484 | 105 | 75 | 180 | |
| ABKHAZIA | 846 | 422 | 67 | 22 | 89 | |
| UKRAINE | 142 | 214 | 37 | 32 | 69 | |
| SERBIA | 41 | 20 | 20 | 20 | 61 | |
| MOLDOVA | 20 | 20 | ||||
| DOMINICAN REPUBLIC | 11000 | |||||
| SENEGAL | 6800 | |||||
| ALGERIA | 84323 | |||||
| USA | 120 | |||||
| ZIMBABWE | 31650 | |||||
| FINLAND | 729 | |||||
| UNITED KINGDOM | 55163 | 24815 | ||||
| ITALY | 167123 | 76061 | ||||
| BANGLADESH | 52695 | |||||
| SPAIN | 126765 | 2901 | ||||
| KOREA (DPRK) | 744 | |||||
| FRANCE | 276 | |||||
| NAMIBIA | 25 | |||||
| KENYA | 37050 | |||||
| NORWAY | 48700 | 23311 | ||||
| ICELAND | 3927 | |||||
| UNITED ARAB EMIRATES | 5500 | 3119 | ||||
| JORDAN | 12500 | |||||
| Total | 5332657 | 5178288 | 409014 | 541414 | 735946 | 1686374 |
 |
Exports of corn to Russia by month, cumulative total, MT
| Exports by Month, cumulative totals, MT | 2016 | 2017 | 2018 |
| jan | 273972 | 506426 | 409014 |
| feb | 963292 | 937908 | 950428 |
| mar | 1632687 | 1561087 | 1686374 |
| apr | 2310094 | 1869884 | |
| may | 2750775 | 2364780 | |
| jun | 2948902 | 2814089 | |
| jul | 2969509 | 3201546 | |
| aug | 2991893 | 3332510 | |
| sep | 3395580 | 3651915 | |
| oct | 3934947 | 4063217 | |
| nov | 4791795 | 4625286 | |
| dec | 5332657 | 5178288 |
 |
Imports of corn from Russia by month, cumulative total, MT
| Imports by Month, cumulative totals, MT | 2016 | 2017 | 2018 |
| jan | 3717 | 7048 | 10412 |
| feb | 11594 | 15698 | 18851 |
| mar | 21354 | 29636 | 26603 |
| apr | 24522 | 34822 | |
| may | 25133 | 35959 | |
| jun | 25945 | 37088 | |
| jul | 26155 | 38506 | |
| aug | 26743 | 39998 | |
| sep | 29296 | 41041 | |
| oct | 30410 | 41927 | |
| nov | 33831 | 45862 | |
| dec | 40951 | 52318 |
 |
Добавить комментарий