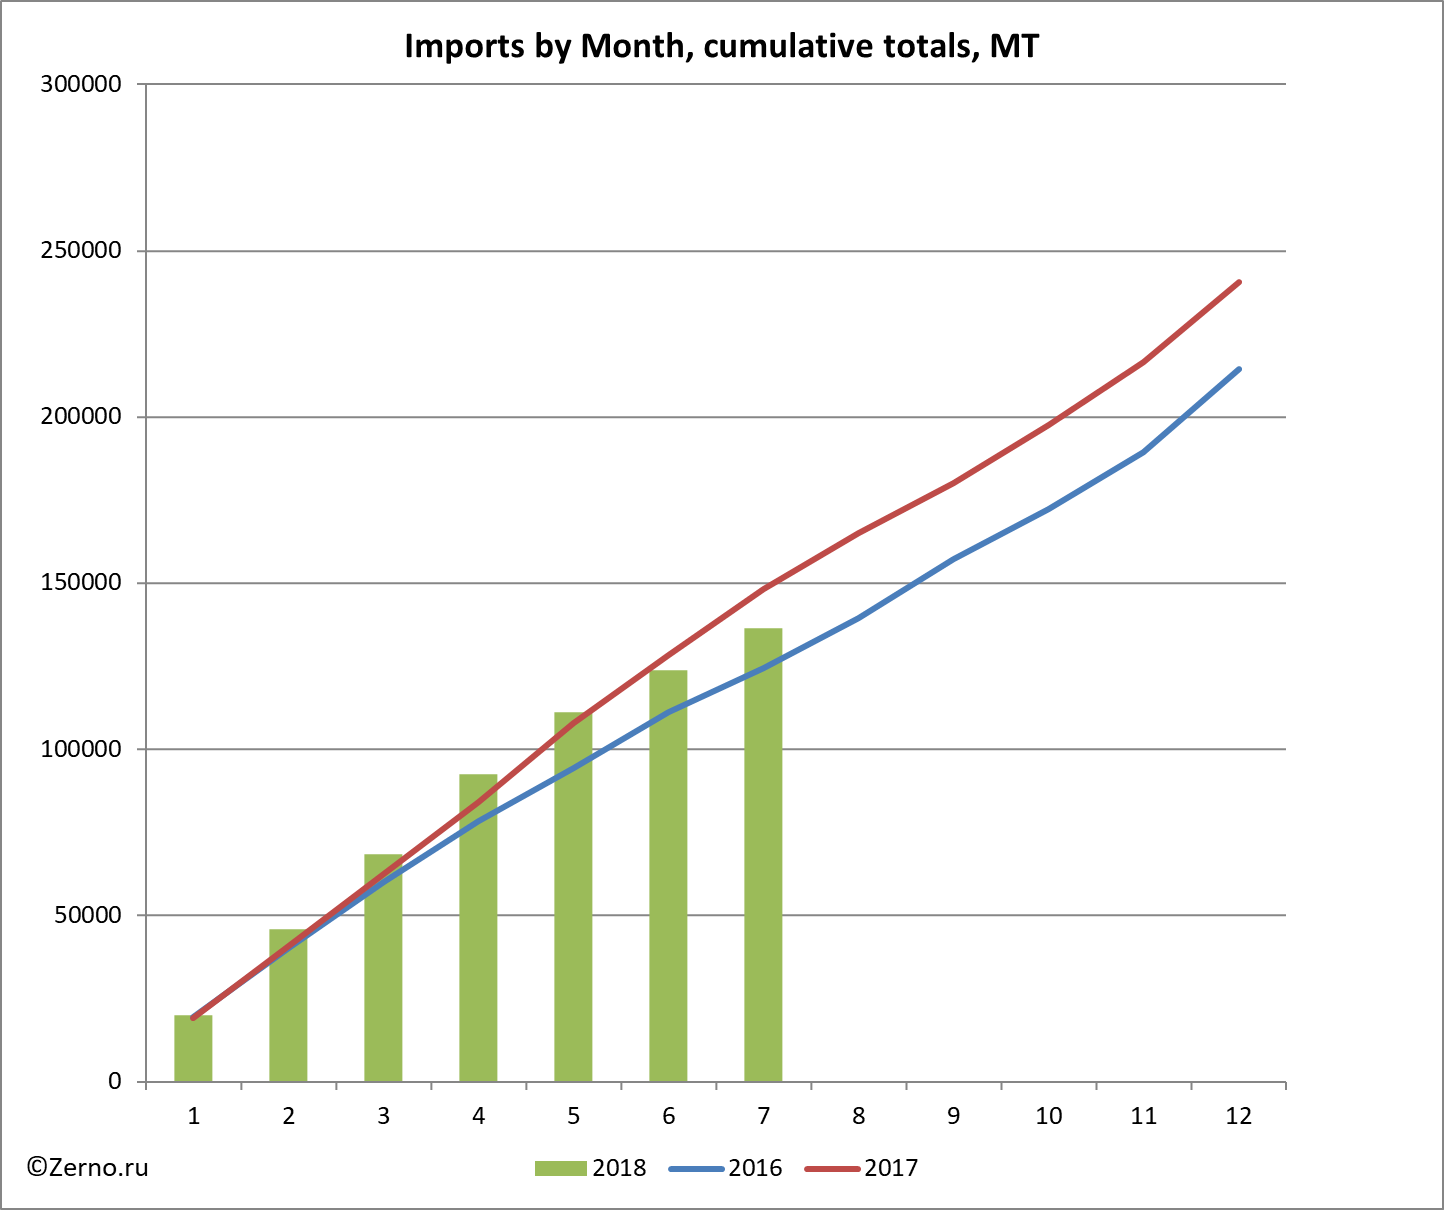
According to the analysis of customs declarations of FCS conducted by Zerno.ru, in July 2018 Russia has imported 12.6 thousand tons of rice. According to the results of 7 months of rice import campaign, Russia has shipped in 136.5 thousand tons (in 2017 - 148.1 thousand MT; in 2016 - 124.5 thousand MT).
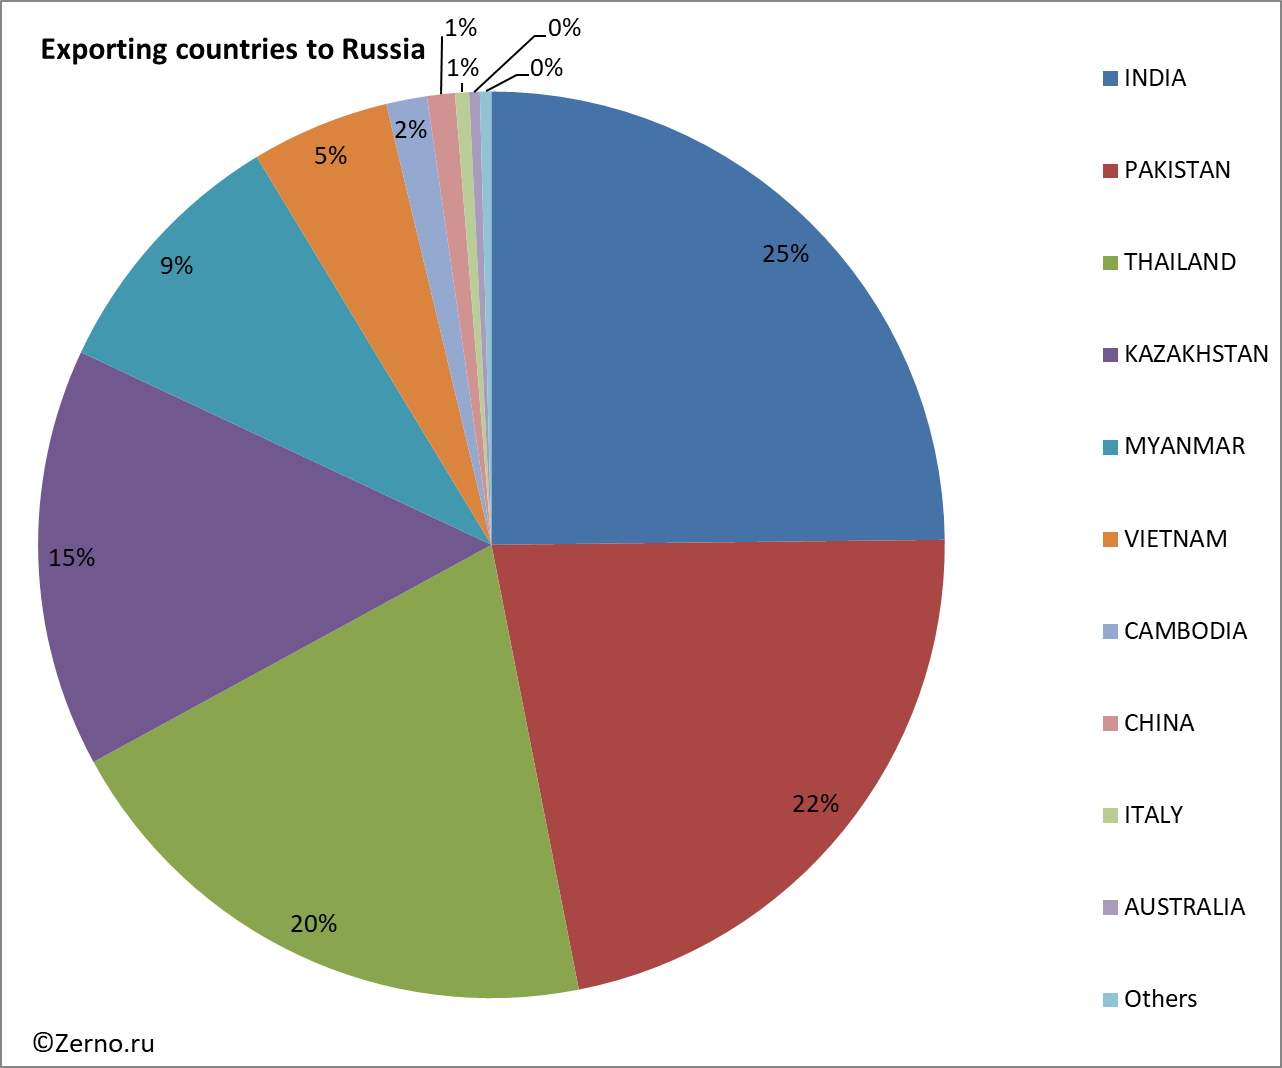
In the period January - July 2018, the main countries exporters of rice to Russia were INDIA (24.82%) and PAKISTAN (22.09%).
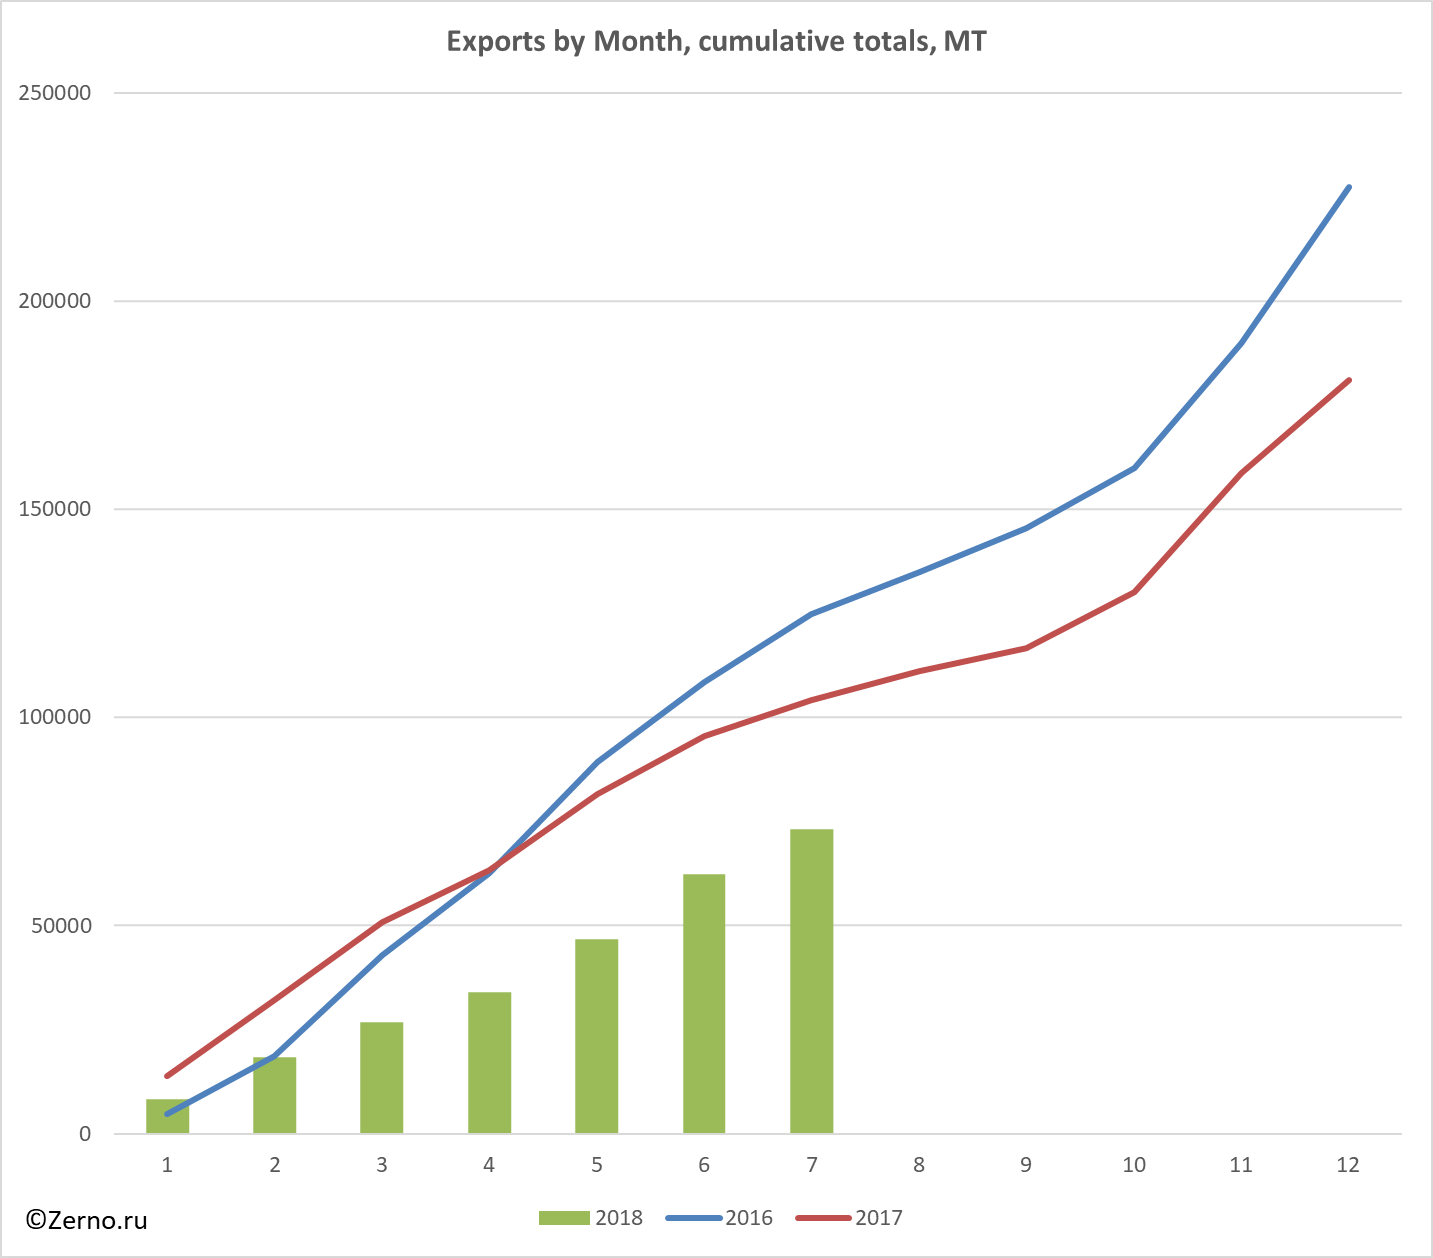
In July 2018 Russia has exported 73.1 thousand tons of rice. According to the results of 7 months of rice export campaign, Russia has shipped out 73.1 thousand tons (in 2017 - 104.3 thousand MT; in 2016 - 124.8 thousand MT).
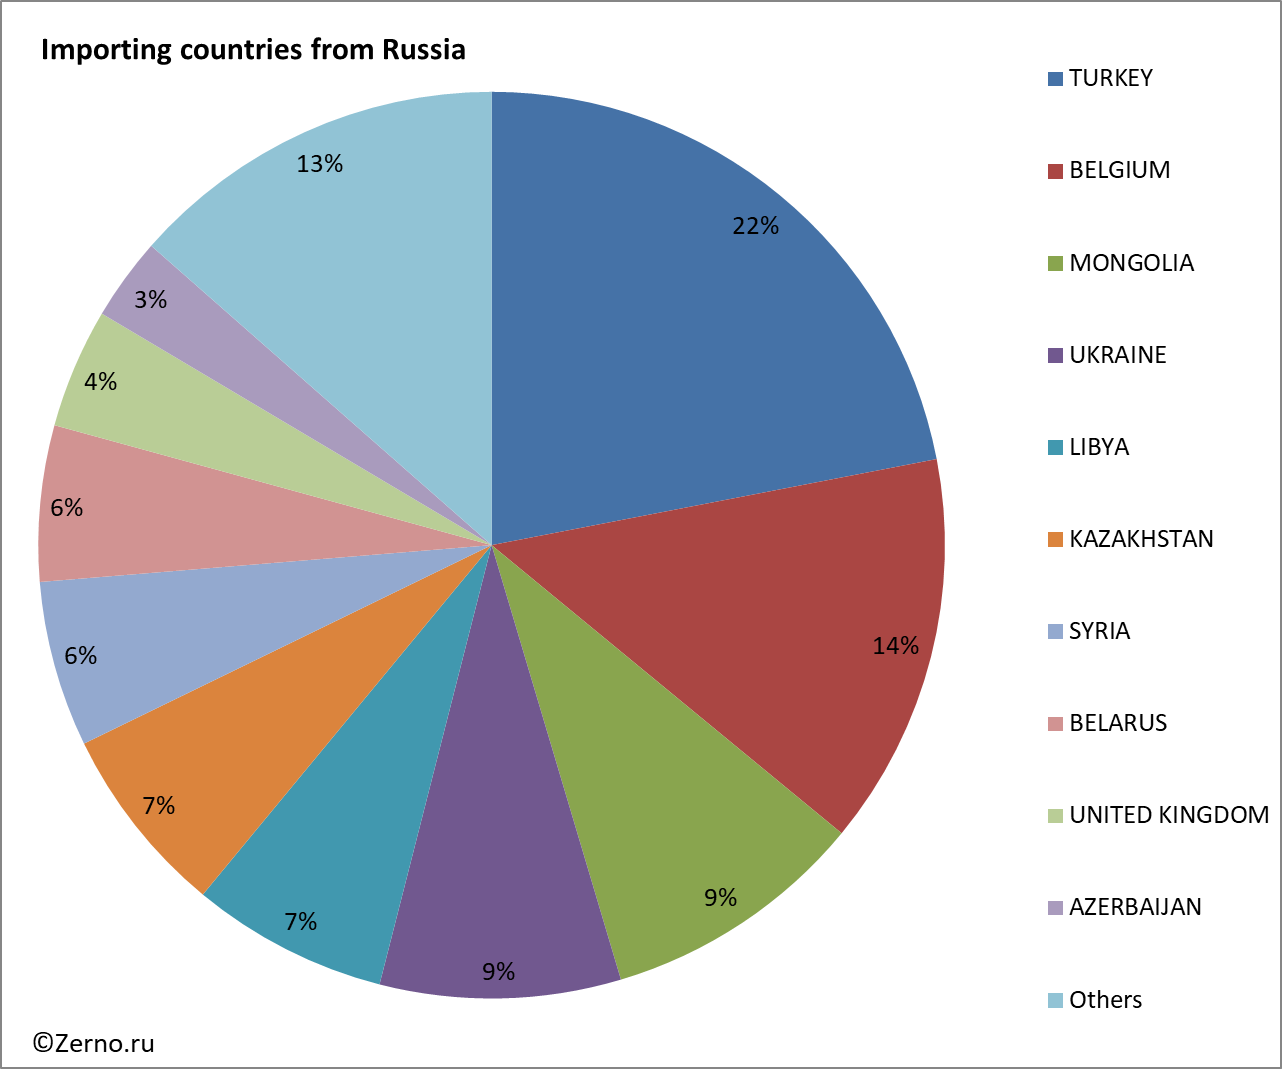
In the period January - July 2018, the main countries importers of rice from Russia were TURKEY (21.96%) and BELGIUM (14.00%).
Tables:
- Countries – exporters of rice to Russia in January - July 2018, MT
- Countries – importers of rice from Russia in January - July 2018, MT
- Exports of rice to Russia by month, cumulative total, MT
- Imports of rice from Russia by month, cumulative total, MT
Countries – exporters of rice to Russia in January - July 2018, MT
| Exporting country to Russia, MT / year, month | 2016 | 2017 | 2018 | 2018 Total |
||||||
| 1 | 2 | 3 | 4 | 5 | 6 | 7 | ||||
| INDIA | 83555 | 59182 | 8170 | 5408 | 5518 | 3284 | 3865 | 3710 | 3935 | 33890 |
| PAKISTAN | 43106 | 24642 | 3099 | 8932 | 4861 | 6115 | 4030 | 2090 | 1024 | 30151 |
| THAILAND | 31025 | 48639 | 4777 | 4343 | 3125 | 5500 | 3325 | 3325 | 3095 | 27491 |
| KAZAKHSTAN | 26600 | 47830 | 2597 | 4155 | 4400 | 3785 | 2741 | 673 | 2037 | 20387 |
| MYANMAR | 770 | 25495 | 775 | 1675 | 3025 | 2425 | 2050 | 1575 | 1250 | 12775 |
| VIETNAM | 22756 | 23060 | 212 | 933 | 1017 | 1927 | 1848 | 546 | 250 | 6733 |
| CAMBODIA | 1913 | 4408 | 246 | 220 | 321 | 150 | 342 | 190 | 516 | 1985 |
| CHINA | 3131 | 4206 | 382 | 224 | 398 | 348 | 1351 | |||
| ITALY | 858 | 744 | 74 | 142 | 278 | 83 | 27 | 75 | 681 | |
| AUSTRALIA | 454 | 65 | 43 | 281 | 65 | 65 | 518 | |||
| USA | 678 | 975 | 46 | 137 | 100 | 100 | 382 | |||
| JAPAN | 25 | 33 | 15 | 14 | 15 | 20 | 64 | |||
| TURKEY | 539 | 49 | 49 | |||||||
| KYRGYZSTAN | 86 | 44 | 44 | |||||||
| REPUBLIC OF KOREA | 62 | 89 | 18 | 18 | ||||||
| FINLAND | 26 | |||||||||
| GREECE | 15 | 30 | ||||||||
| SPAIN | 22 | |||||||||
| Total | 214543 | 240411 | 19942 | 25844 | 22562 | 24189 | 18688 | 12698 | 12594 | 136517 |
 |
Countries – importers of rice from Russia in January - July 2018, MT
| Exports from Russia (breakdown by importing countries), MT | 2016 | 2017 | 2018 | 2018 Total |
||||||
| 1 | 2 | 3 | 4 | 5 | 6 | 7 | ||||
| TURKEY | 102242 | 43551 | 1938 | 2379 | 1821 | 1953 | 2099 | 5682 | 175 | 16048 |
| BELGIUM | 11934 | 30672 | 2090 | 1173 | 1038 | 562 | 1386 | 777 | 3205 | 10232 |
| MONGOLIA | 9460 | 16508 | 1016 | 570 | 542 | 1100 | 1218 | 1420 | 1030 | 6895 |
| UKRAINE | 5786 | 8027 | 559 | 922 | 1321 | 843 | 712 | 802 | 1112 | 6271 |
| LIBYA | 6000 | 5127 | 5127 | |||||||
| KAZAKHSTAN | 8863 | 5738 | 253 | 610 | 445 | 441 | 320 | 1716 | 1181 | 4965 |
| SYRIA | 2175 | 8845 | 350 | 375 | 600 | 500 | 500 | 900 | 1100 | 4325 |
| BELARUS | 5283 | 4125 | 601 | 728 | 614 | 338 | 293 | 729 | 759 | 4061 |
| UNITED KINGDOM | 1098 | 6388 | 766 | 1239 | 649 | 465 | 3119 | |||
| AZERBAIJAN | 14322 | 10838 | 341 | 406 | 72 | 33 | 217 | 71 | 1016 | 2156 |
| MOLDOVA | 3500 | 3502 | 292 | 494 | 90 | 110 | 325 | 554 | 103 | 1968 |
| CHINA | 4819 | 3663 | 225 | 50 | 1340 | 24 | 1639 | |||
| ALBANIA | 2475 | 2900 | 300 | 700 | 215 | 200 | 1415 | |||
| GEORGIA | 476 | 958 | 55 | 168 | 74 | 132 | 100 | 97 | 76 | 702 |
| LEBANON | 6570 | 4250 | 300 | 50 | 150 | 50 | 125 | 675 | ||
| TURKMENISTAN | 23139 | 12380 | 135 | 135 | 68 | 148 | 85 | 572 | ||
| ARMENIA | 785 | 1692 | 123 | 116 | 68 | 69 | 104 | 81 | 562 | |
| UZBEKISTAN | 268 | 325 | 203 | 528 | ||||||
| KYRGYZSTAN | 2918 | 1625 | 68 | 271 | 68 | 406 | ||||
| TAJIKISTAN | 967 | 338 | 338 | |||||||
| JORDAN | 75 | 250 | 325 | |||||||
| UNITED ARAB EMIRATES | 70 | 125 | 125 | 250 | ||||||
| NETHERLANDS | 5620 | 10775 | 200 | 200 | ||||||
| GAMBIA | 150 | 800 | 75 | 75 | 150 | |||||
| LATVIA | 100 | 100 | 20 | 20 | 20 | 60 | ||||
| ISRAEL | 233 | 143 | 50 | 50 | ||||||
| SWEDEN | 25 | 25 | ||||||||
| ABKHAZIA | 46 | 28 | 15 | 15 | ||||||
| KENYA | 45 | |||||||||
| THAILAND | 200 | |||||||||
| IRAQ | 810 | 1456 | ||||||||
| BAHRAIN | 25 | |||||||||
| SPAIN | 5755 | 298 | ||||||||
| SIERRA LEONE | 250 | |||||||||
| SINGAPORE | 24 | |||||||||
| EGYPT | 1000 | |||||||||
| KOREA (DPRK) | 324 | |||||||||
| QATAR | 25 | 200 | ||||||||
| SUDAN | 250 | |||||||||
| NEW ZEALAND | 20 | 22 | ||||||||
| SOUTH OSSETIA | 18 | 14 | ||||||||
| CANADA | 66 | |||||||||
| AUSTRALIA | 20 | 20 | ||||||||
| SAUDI ARABIA | 250 | 500 | ||||||||
| USA | 11 | |||||||||
| Total | 227408 | 181000 | 8373 | 9983 | 8518 | 7091 | 12866 | 15571 | 10677 | 73079 |
 |
Exports of rice to Russia by month, cumulative total, MT
| Exports by Month, cumulative totals, MT | 2016 | 2017 | 2018 |
| jan | 4675 | 13877 | 8373 |
| feb | 18746 | 32175 | 18356 |
| mar | 42812 | 50785 | 26873 |
| apr | 62567 | 63427 | 33965 |
| may | 89291 | 81509 | 46831 |
| jun | 108428 | 95594 | 62402 |
| jul | 124819 | 104280 | 73079 |
| aug | 135016 | 111144 | |
| sep | 145503 | 116710 | |
| oct | 159863 | 130221 | |
| nov | 190038 | 158652 | |
| dec | 227408 | 181000 |
 |
Imports of rice from Russia by month, cumulative total, MT
| Imports by Month, cumulative totals, MT | 2016 | 2017 | 2018 |
| jan | 19454 | 19244 | 19942 |
| feb | 40173 | 40891 | 45786 |
| mar | 59978 | 62589 | 68348 |
| apr | 78564 | 84236 | 92537 |
| may | 94455 | 107869 | 111225 |
| jun | 111151 | 128413 | 123922 |
| jul | 124482 | 148139 | 136517 |
| aug | 139378 | 165020 | |
| sep | 157134 | 180189 | |
| oct | 172281 | 197571 | |
| nov | 189394 | 216576 | |
| dec | 214543 | 240411 |
 |
Добавить комментарий