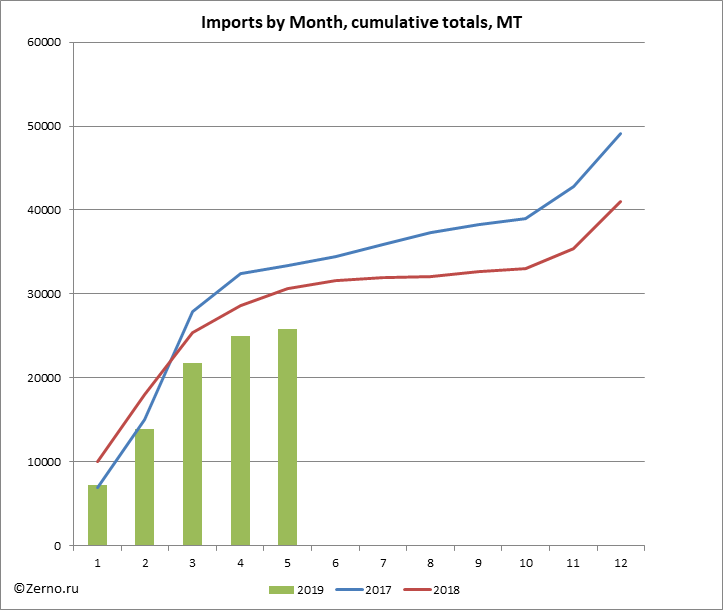
According to the analysis of customs declarations of FCS conducted by Zerno.ru, in May 2019 Russia has imported 0.9 thousand tons of corn (HS code 1005). According to the results of 5 months of corn import campaign, Russia has shipped in 25.9 thousand tons (in 2018 - 30.6 thousand MT; in 2017 - 33.4 thousand MT).
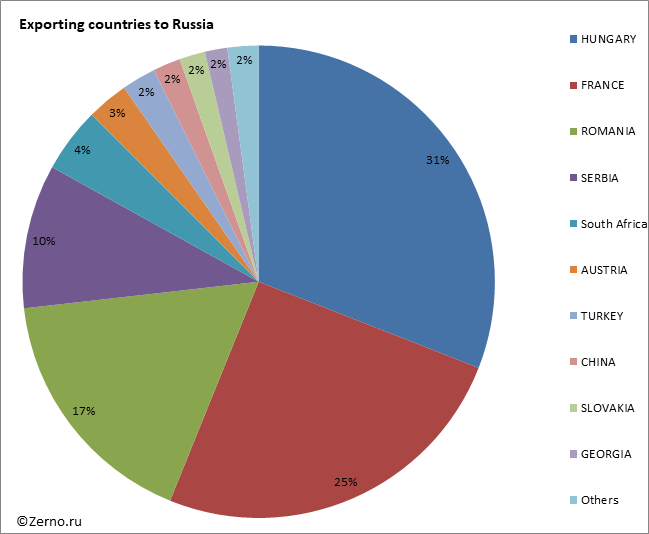
In the period January - May 2019, the main countries exporters of corn to Russia were HUNGARY (30.94%) and FRANCE (25.18%).
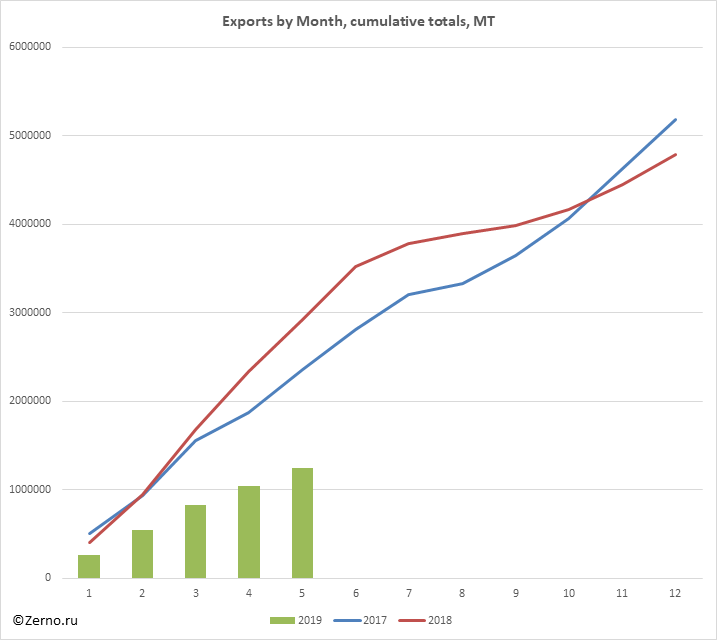
In May 2019 Russia has exported 204.4 thousand tons of corn. According to the results of 5 months of corn export campaign, Russia has shipped out 1249.5 thousand tons (in 2018 - 2924.8 thousand MT; in 2017 - 2363.8 thousand MT).
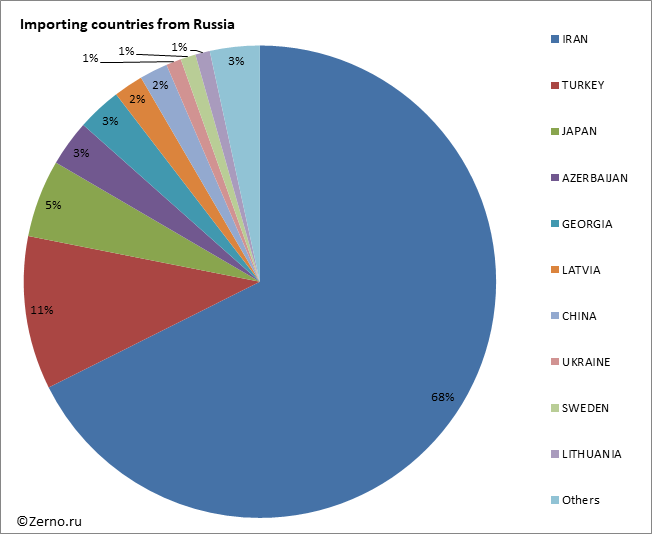
In the period January - May 2019, the main countries importers of corn from Russia were IRAN (67.61%) and TURKEY (10.49%).
* the only monthly export/import of at least 60 MT is taken into account
Tables:
- Countries – exporters of corn to Russia in January - May 2019, MT
- Countries – importers of corn from Russia in January - May 2019, MT
- Exports of corn to Russia by month, cumulative total, MT
- Imports of corn from Russia by month, cumulative total, MT
Countries – exporters of corn to Russia in January - May 2019, MT
| Exporting country to Russia, MT / year, month | 2017 | 2018 | 2019 | 2019 Total |
||||
| 1 | 2 | 3 | 4 | 5 | ||||
| HUNGARY | 14594 | 13861 | 3775 | 2167 | 1647 | 399 | 11 | 8000 |
| FRANCE | 11974 | 9503 | 1950 | 1823 | 1815 | 546 | 377 | 6511 |
| ROMANIA | 7545 | 6417 | 755 | 1694 | 1236 | 717 | 14 | 4417 |
| SERBIA | 4043 | 2752 | 138 | 362 | 1750 | 289 | 10 | 2549 |
| South Africa | 100 | 1421 | 99 | 199 | 249 | 325 | 274 | 1147 |
| AUSTRIA | 544 | 288 | 142 | 149 | 333 | 114 | 738 | |
| TURKEY | 95 | 143 | 127 | 451 | 25 | 604 | ||
| CHINA | 75 | 194 | 440 | 47 | 487 | |||
| SLOVAKIA | 365 | 575 | 325 | 65 | 32 | 34 | 456 | |
| GEORGIA | 211 | 335 | 143 | 207 | 50 | 399 | ||
| GERMANY | 176 | 111 | 157 | 268 | ||||
| KAZAKHSTAN | 20 | 20 | 20 | 20 | 20 | 100 | ||
| MOLDOVA | 139 | 121 | 81 | 81 | ||||
| SPAIN | 901 | 66 | 11 | 24 | 35 | |||
| NEW ZEALAND | 175 | 65 | 28 | 28 | ||||
| BRAZIL | 300 | 523 | 25 | 25 | ||||
| POLAND | 85 | 11 | 11 | |||||
| UKRAINE | 6906 | 4793 | ||||||
| ARGENTINA | 855 | |||||||
| Total | 49083 | 41057 | 7205 | 6755 | 7873 | 3116 | 909 | 25858 |
 |
Countries – importers of corn from Russia in January - May 2019, MT
| Exports from Russia (breakdown by importing countries), MT | 2017 | 2018 | 2019 | 2019 Total |
||||
| 1 | 2 | 3 | 4 | 5 | ||||
| IRAN | 786222 | 1402752 | 158777 | 161003 | 206587 | 176518 | 141937 | 844822 |
| TURKEY | 1320766 | 1252972 | 52734 | 12308 | 18055 | 12826 | 35127 | 131051 |
| JAPAN | 66808 | 67088 | 40692 | 22580 | 3076 | 66348 | ||
| AZERBAIJAN | 93775 | 49419 | 10302 | 17304 | 3321 | 6254 | 2099 | 39279 |
| GEORGIA | 107050 | 103991 | 5087 | 7581 | 5605 | 8004 | 11544 | 37820 |
| LATVIA | 82285 | 237168 | 15434 | 5506 | 2964 | 1384 | 25288 | |
| CHINA | 1944 | 39486 | 3249 | 7009 | 5754 | 3855 | 4144 | 24011 |
| UKRAINE | 117 | 97 | 32 | 1521 | 2376 | 3037 | 5970 | 12937 |
| SWEDEN | 3846 | 23323 | 2332 | 7089 | 3500 | 12921 | ||
| LITHUANIA | 17015 | 37210 | 4197 | 5200 | 3029 | 12425 | ||
| REPUBLIC OF KOREA | 1010069 | 638935 | 353 | 4980 | 5340 | 686 | 686 | 12045 |
| BELARUS | 28074 | 150987 | 6699 | 1509 | 1567 | 1084 | 138 | 10997 |
| ARMENIA | 3998 | 27873 | 1330 | 3334 | 629 | 2931 | 1611 | 9835 |
| GERMANY | 37646 | 26181 | 3744 | 3744 | ||||
| MONGOLIA | 3193 | 8954 | 282 | 282 | 844 | 13 | 773 | 2194 |
| FINLAND | 729 | 12345 | 1326 | 1326 | ||||
| DENMARK | 69435 | 14187 | 1036 | 1036 | ||||
| KAZAKHSTAN | 3089 | 1244 | 19 | 130 | 159 | 318 | 123 | 749 |
| CANADA | 1784 | 1800 | 300 | 300 | ||||
| JORDAN | 270 | 270 | ||||||
| KYRGYZSTAN | 37 | 20 | 22 | 79 | ||||
| VIETNAM | 742516 | 100196 | ||||||
| KOREA (DPRK) | 744 | |||||||
| IRELAND | 3280 | |||||||
| FRANCE | 276 | |||||||
| UNITED KINGDOM | 24815 | 2444 | ||||||
| GHANA | 239 | |||||||
| LEBANON | 297258 | 277203 | ||||||
| BRUNEI-DARUSSALAM | 3500 | |||||||
| ITALY | 76061 | |||||||
| NORWAY | 23311 | 24309 | ||||||
| UNITED ARAB EMIRATES | 3119 | |||||||
| KENYA | 37050 | |||||||
| UZBEKISTAN | 995 | 2508 | ||||||
| ESTONIA | 198 | 606 | ||||||
| LIBYA | 44100 | 14784 | ||||||
| ALBANIA | 6112 | 3299 | ||||||
| SENEGAL | 6800 | |||||||
| EGYPT | 5394 | |||||||
| IRAQ | 33481 | |||||||
| SPAIN | 2901 | |||||||
| BANGLADESH | 949 | |||||||
| CYPRUS | 27296 | 34845 | ||||||
| MAURITANIA | 2625 | |||||||
| SYRIA | 61254 | 56730 | ||||||
| ROMANIA | 3114 | 10622 | ||||||
| GREECE | 114267 | 74832 | ||||||
| TURKMENISTAN | 920 | |||||||
| ABKHAZIA | 399 | 133 | ||||||
| NETHERLANDS | 66105 | 34782 | ||||||
| Total | 5176535 | 4783692 | 266971 | 275747 | 282331 | 220008 | 204420 | 1249477 |
 |
Exports of corn to Russia by month, cumulative total, MT
| Exports by Month, cumulative totals, MT | 2017 | 2018 | 2019 |
| jan | 506385 | 408850 | 266971 |
| feb | 937747 | 950027 | 542718 |
| mar | 1560647 | 1685638 | 825049 |
| apr | 1869097 | 2338296 | 1045057 |
| may | 2363835 | 2924774 | 1249477 |
| jun | 2812917 | 3522324 | |
| jul | 3200251 | 3783846 | |
| aug | 3331185 | 3889798 | |
| sep | 3650439 | 3988019 | |
| oct | 4061646 | 4164154 | |
| nov | 4623594 | 4445944 | |
| dec | 5176535 | 4783692 |
 |
Imports of corn from Russia by month, cumulative total, MT
| Imports by Month, cumulative totals, MT | 2017 | 2018 | 2019 |
| jan | 6921 | 10087 | 7205 |
| feb | 15048 | 18075 | 13959 |
| mar | 27939 | 25357 | 21833 |
| apr | 32401 | 28636 | 24949 |
| may | 33431 | 30614 | 25858 |
| jun | 34488 | 31601 | |
| jul | 35906 | 31918 | |
| aug | 37348 | 32085 | |
| sep | 38253 | 32649 | |
| oct | 39022 | 32978 | |
| nov | 42791 | 35430 | |
| dec | 49083 | 41057 |
 |
Добавить комментарий